European Conflict & Security Intelligence
Conflict events and defence budgets in Europe, side by side — then a pre-specified event study of whether proximity to Russia predicts the rise in military burden.
The problem
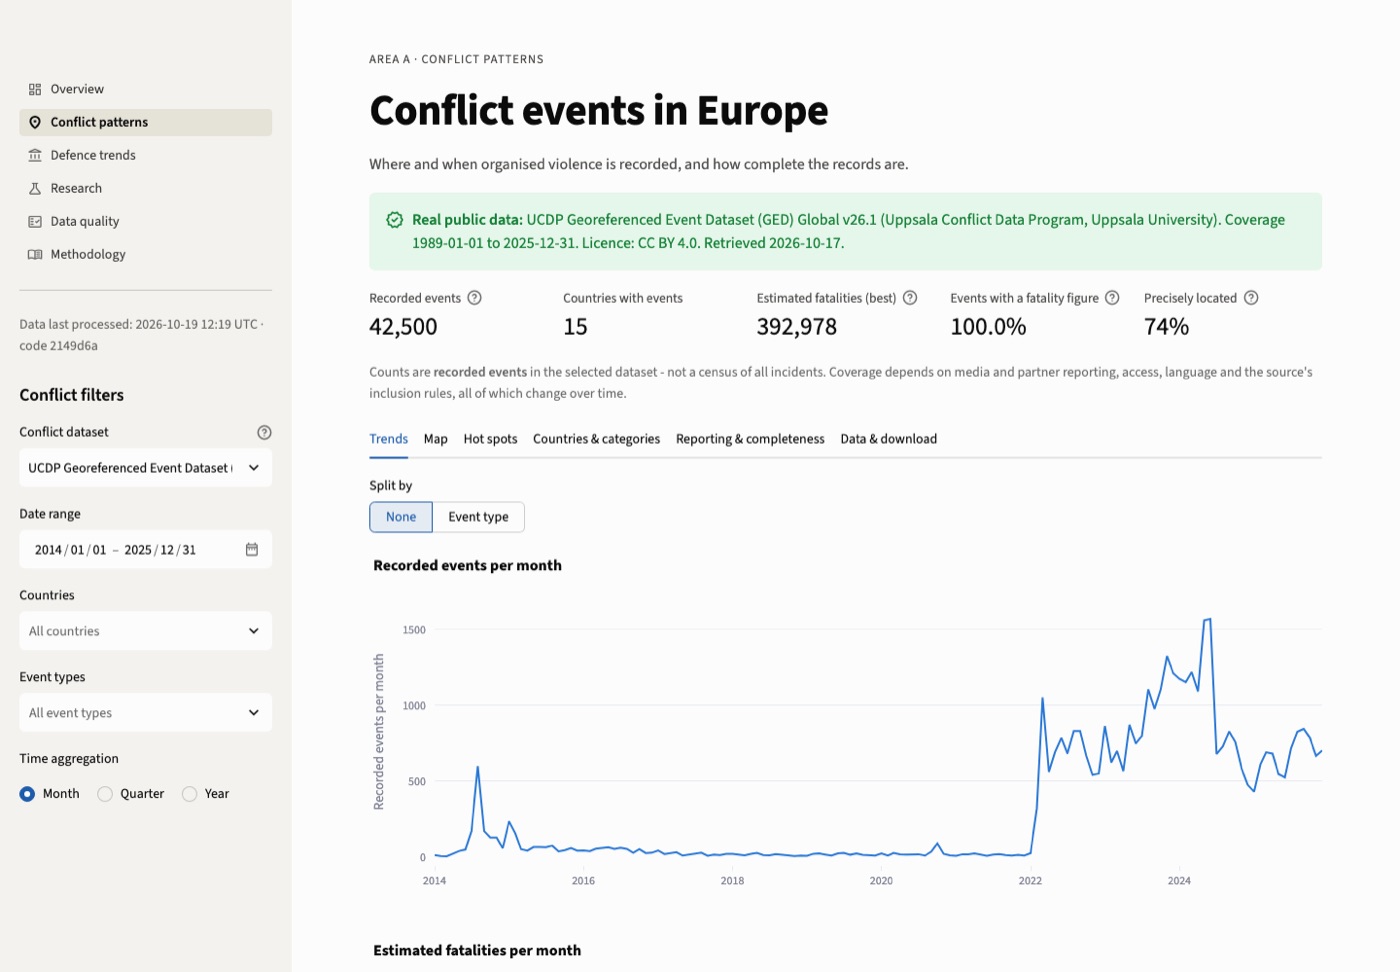
Conflict and defence data are easy to chart and easy to misread. Event counts move when reporting changes, fatality figures are wide estimates, and spending series mix price bases. Put conflict and spending on one chart and it invites a causal story the data cannot support.
The data
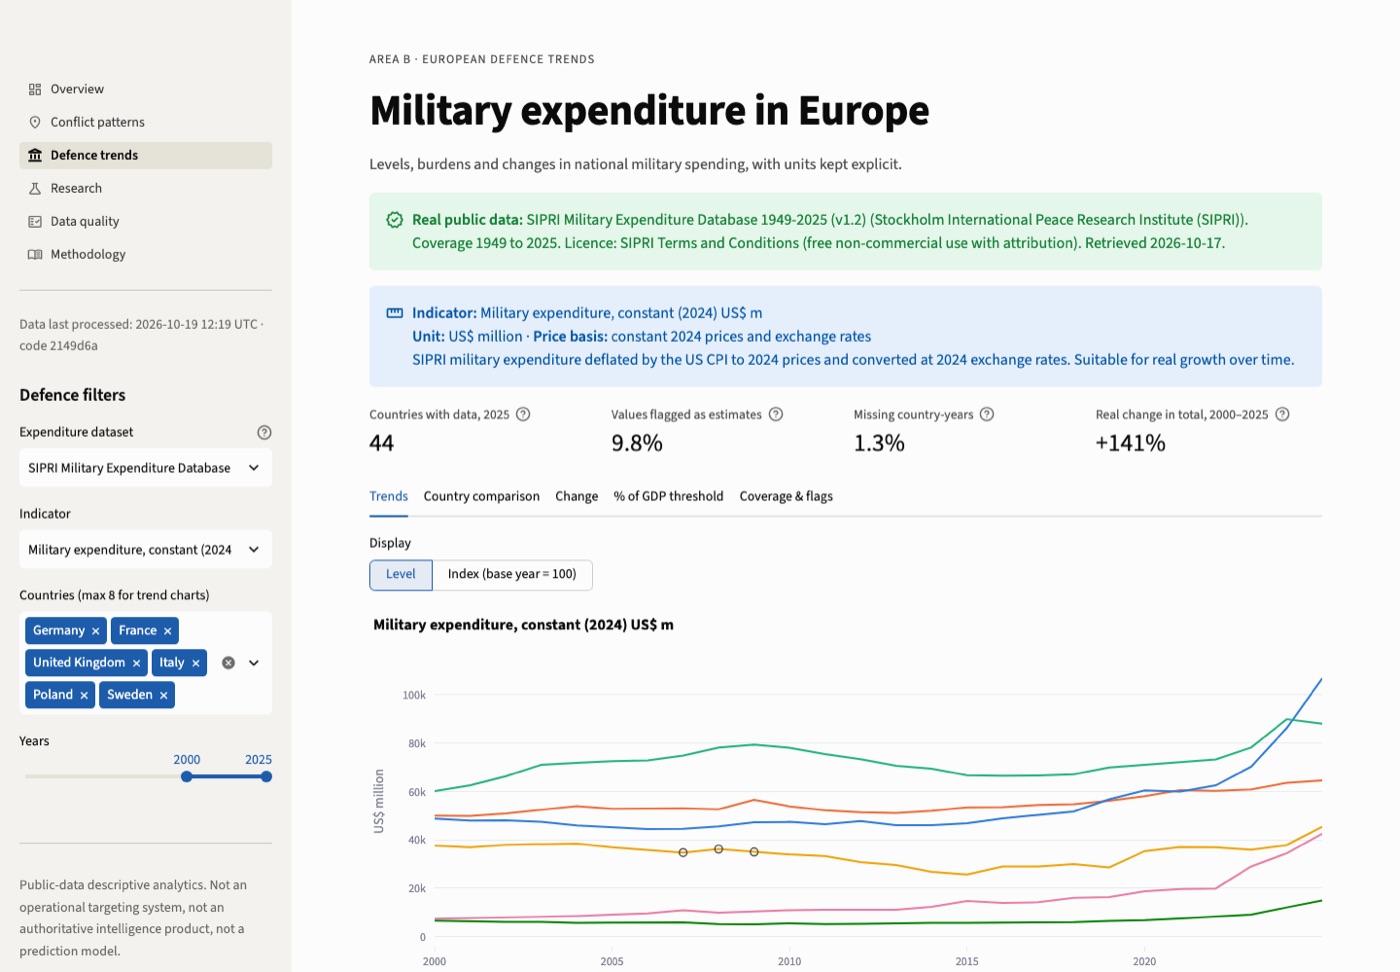
The UCDP Georeferenced Event Dataset (58,016 European events, 1989–2025) and the SIPRI Military Expenditure Database, each file recorded with URL, retrieval time and SHA-256. ACLED is supported but never redistributed, as its licence requires.
What I built
A validated DuckDB pipeline with machine-readable quality reports and a GeoPandas point-in-country check; the code refuses invalid operations such as growth on current prices.
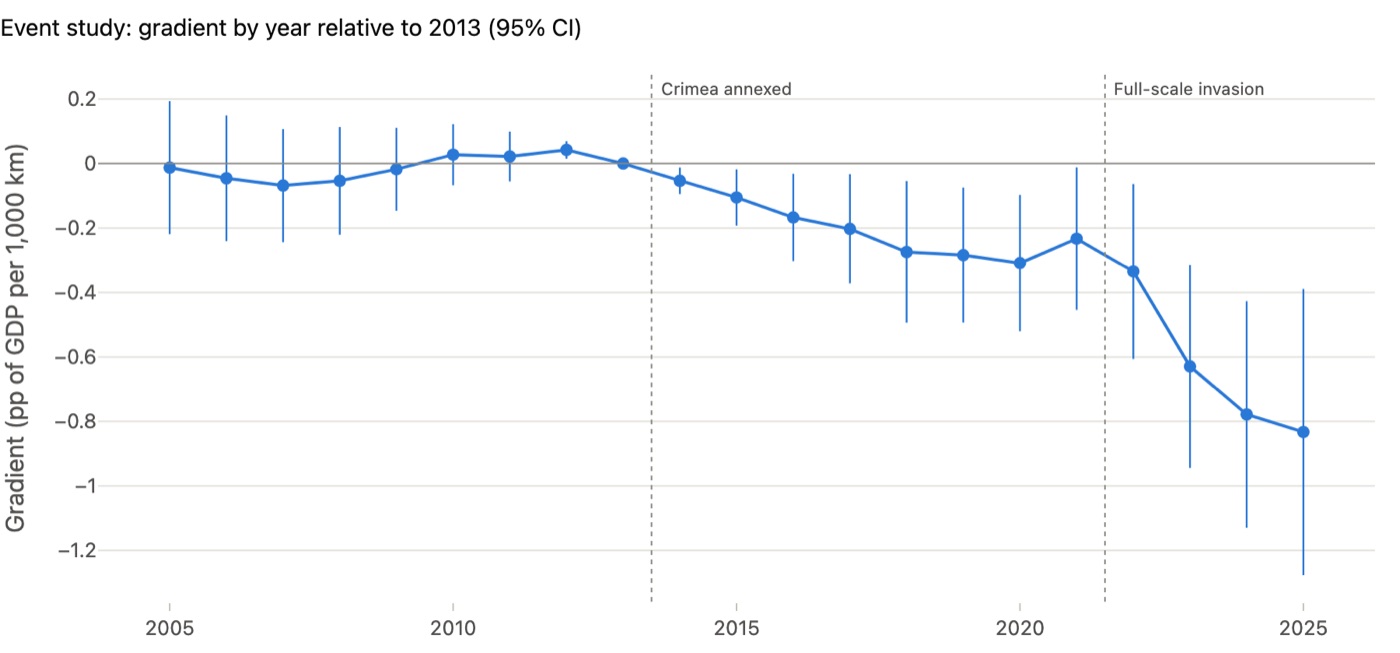
On top, an event study written down before any estimate: military burden in 37 countries, 2005–2025, against each capital's distance to Russia, with two-way fixed effects and a wild cluster bootstrap.
The result
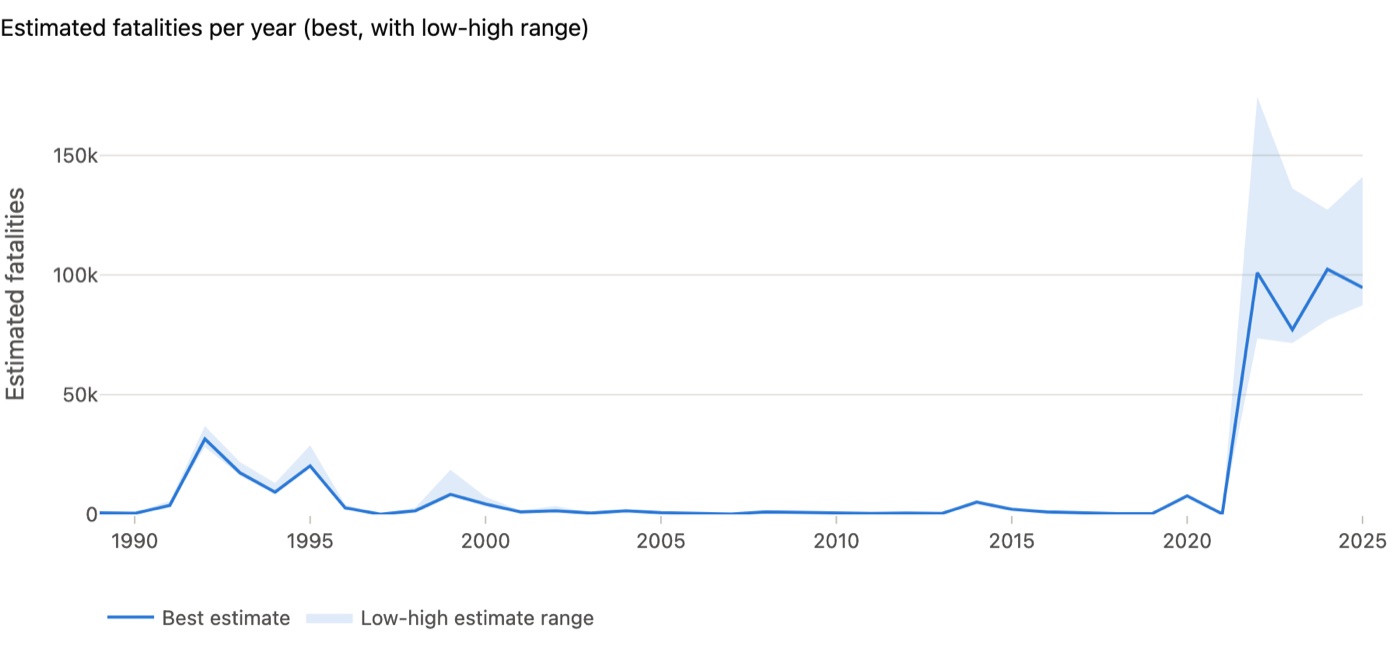
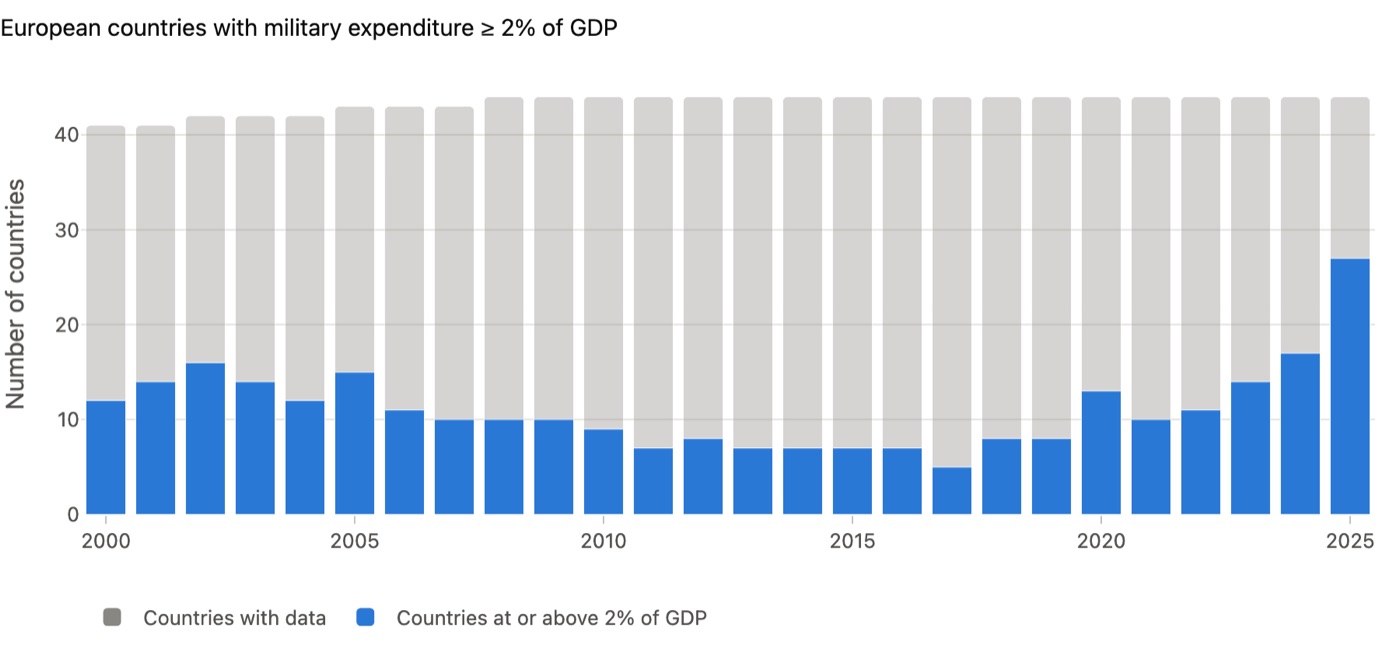
After 2022, burden rose 0.44 pp of GDP more per 1,000 km closer to Russia (bootstrap p < 0.001), robust to every pre-specified check. The post-2014 gradient is weaker and fails its pre-trend test, and the write-up says so. Separately, the 2025 drop in recorded events turned out to be a coding change, not de-escalation.
Technical notes
For anyone who wants the detail.
The point-in-country test flagged 1,177 events outside their stated country's present-day border. Almost all turned out to be UCDP's historical state coding — 1990s events in Croatia, Bosnia and Kosovo recorded under "Serbia (Yugoslavia)". That is a property of the source, not an error, but it changes what a country filter means.
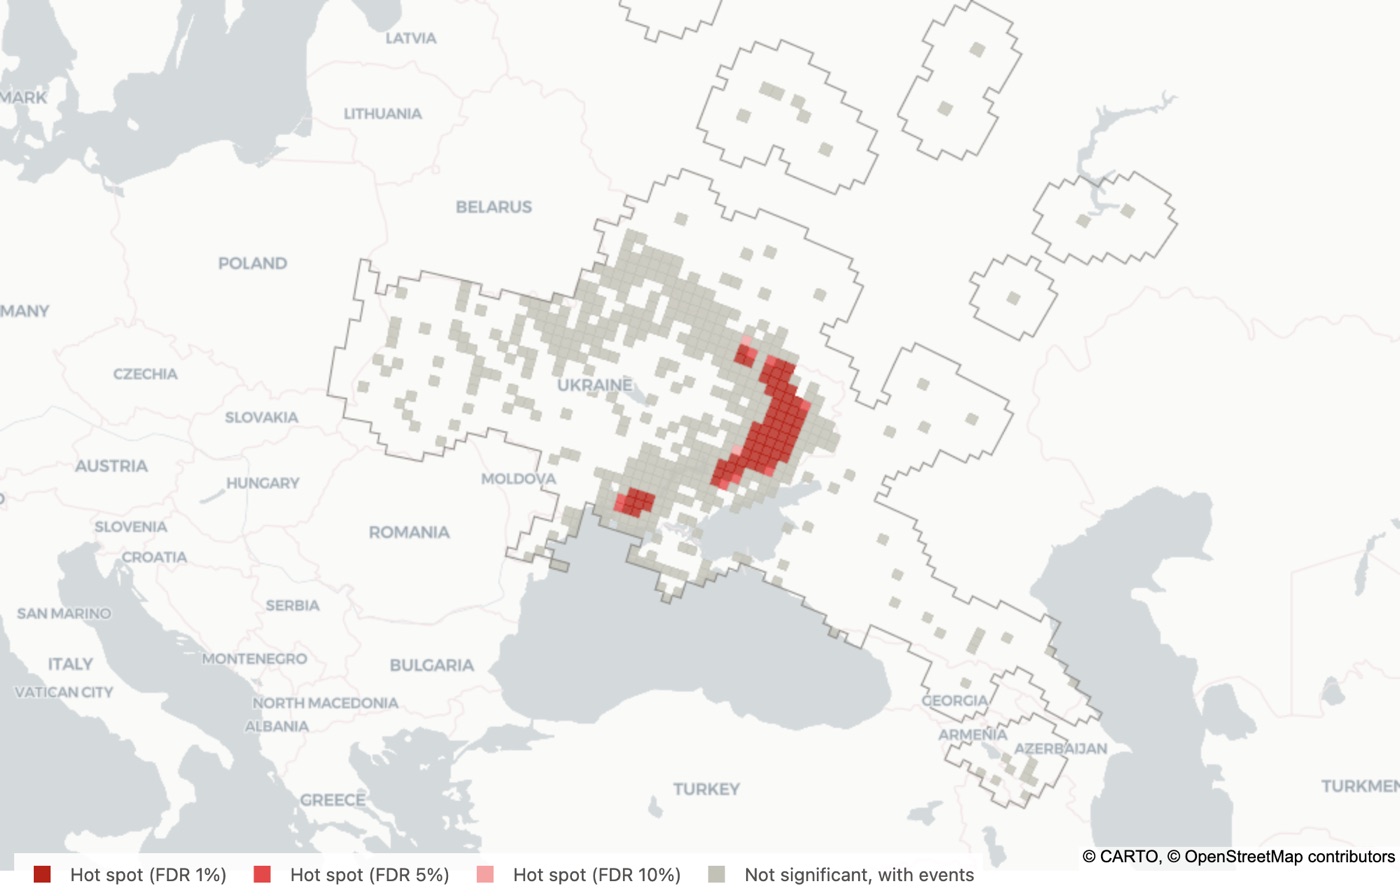
The hot-spot layer runs Getis-Ord Gi* on an equal-area grid that keeps every zero-event cell inside the study area — dropping them is the classic error that makes every busy cell look ordinary — and corrects thousands of simultaneous tests with a false discovery rate. It matches PySAL to ten decimal places, and the cell-size dependence is reported at 10, 25 and 50 km rather than hidden.
Totals across countries use a balanced panel, so a country's series starting part-way through cannot inflate growth. The research brief is generated from the database and pinned to the input file hashes; it warns when the data have changed since the commentary was written. 53 tests run in CI, including a headless render of every dashboard page.
The estimator is plain numpy OLS so that 9,999 bootstrap draws reuse one design matrix (about 0.1 s); it is tested against statsmodels to machine precision, checked for correct size under a simulated null, and shown to recover a planted effect. Robustness covers levels instead of shares, war-event distance, a NATO control, dropping the Baltic states, leave-one-out and a placebo year. A randomization test that permutes distances across countries (p < 0.001) and a synthetic control for the Baltic states — 1.5 pp of GDP above a distant-country comparison after 2022, first among 21 placebos — confirm the gradient, while Estonia, Latvia and Poland individually cannot be separated from placebo noise, and the write-up says so.