Stockholm TMA
A live air traffic display that never lies about how old its data is.
The problem
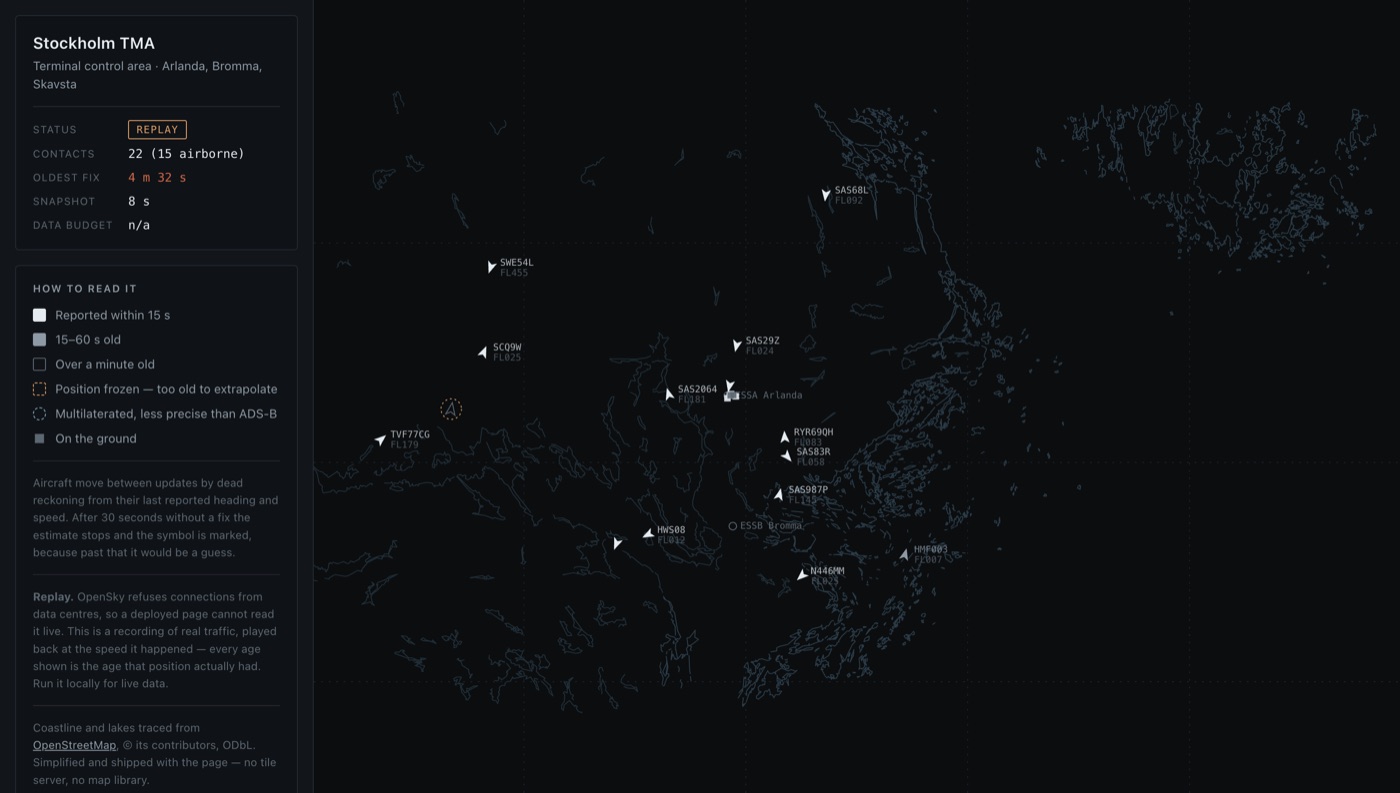
Every live flight tracker draws an aircraft that stopped transmitting four minutes ago exactly like one that reported a second ago. The symbol keeps gliding across the map, at the speed and heading it last had, and nothing on screen tells you that what you are watching is a guess.
In a twenty-aircraft sample I took while building this, one contact was already 513 seconds old — eight and a half minutes. Any tracker showing that aircraft as it showed the others was misleading its user at that moment.
The data
ADS-B positions from the OpenSky Network, a crowd-sourced receiver network, for the Stockholm terminal control area — Arlanda, Bromma, Skavsta, and the approaches on either side.
Two limits set the whole design. The free allowance is 4,000 credits a day, so the display cannot make one call per viewer. And positions arrive with five-second resolution, while an airliner covers about 950 metres in five seconds — which is why the display has to estimate between updates rather than let the symbols jump.
What I built
A display built on one rule: never show a position more confidently than the data supports. Between updates aircraft move by dead reckoning from their last reported heading and speed, but that estimate stops after thirty seconds — beyond that the position freezes and the symbol is ringed, because the assumption that a heading was held is true for seconds and false for a minute.
The symbols say what they are. Aircraft on the ground are squares rather than chevrons, because they have a position but no meaningful heading to point at. A multilaterated position sits inside a circle rather than on a point, because that is the precision it has. Contacts older than a minute go hollow; past five minutes they are dropped rather than left on screen.
Ages are measured against the data source's clock and advanced with monotonic time, so a viewer whose laptop clock is wrong still sees correct ages.
The result
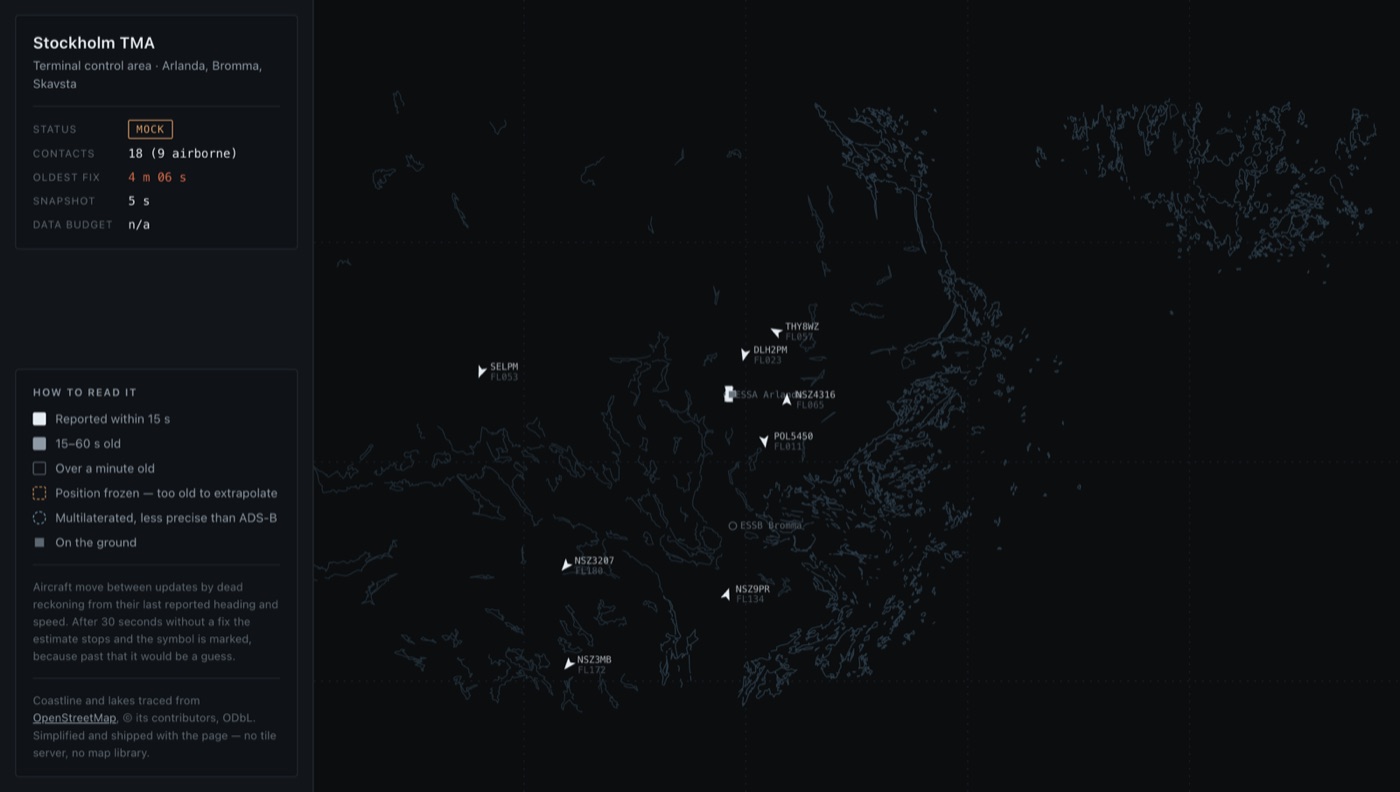
It runs, it is deployed, and the deployed version is a replay — which is the part I would talk about first.
OpenSky refuses connections from data centres. I found that by deploying and reading a connect timeout, then confirming it from Vercel in Washington, Vercel in Stockholm, and Cloudflare Workers: three networks on two continents failing at the same hop, while a home connection reaches the same address in 39 milliseconds. So the public page cannot be live, and there were two honest options — show nothing, or show a recording and call it a recording. It replays five minutes of real traffic at the speed it happened, reads REPLAY rather than LIVE, and says so in the panel. Run it locally with credentials and it is live.
Technical notes
For anyone who wants the detail.
48 tests, no dependencies, no build step. TypeScript is run natively by Node, and the browser imports the same core modules the tests run against — with their types stripped by Node's own stripper — rather than a second copy of the projection maths that could quietly drift from the tested one. A test asserts the generated browser copy is byte-identical to its source.
OpenSky blocks cross-origin browser requests, so the live path needs a proxy, and the daily credit allowance means that proxy must not fetch per viewer. A shared cache in front of the endpoint bounds it to one upstream call every eight seconds regardless of how many people are watching. Access tokens live thirty minutes; concurrent refreshes collapse into a single request, so a burst arriving at minute thirty does not become a burst of token calls.
The map is not a tile layer. Coastline and lakes were traced once from OpenStreetMap — 1.8 million points as downloaded — and simplified to under 10,000, since anything finer than half a pixel at this scale cannot be seen. The result is a 171 KB file that ships with the page: no tile server, no map library, no API key, nothing fetched from a third party at runtime.