Traffic Zones and Air Quality
Italian cities closed their centres to traffic in 2015. Did the air actually get cleaner, or was it going to anyway?
The problem
Several Italian cities introduced limited-traffic zones — zone a traffico limitato — in their centres in 2015, and PM10 readings fell afterwards. It is tempting to call that the policy working, and wrong: particulate levels were drifting down across the whole country over that decade, on cleaner engines and milder winters alike.
A before-and-after comparison would hand the policy credit for a trend that was already happening. The question is whether the cities that acted diverged from comparable cities that did not.
The data
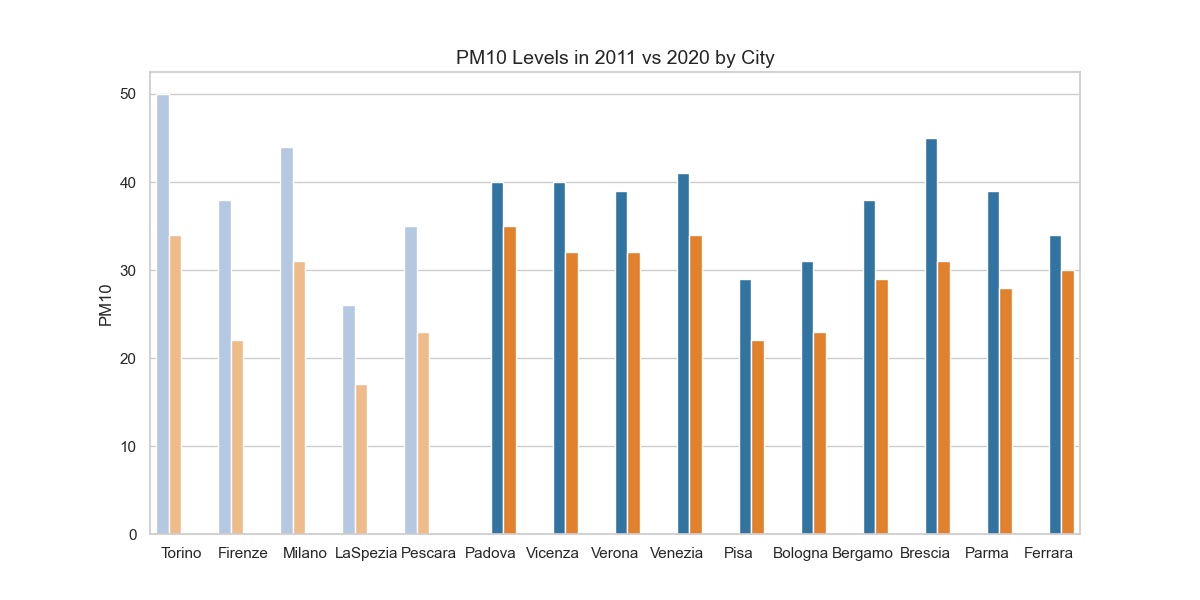
Annual average PM10 for fifteen Italian cities from 2011 to 2020 — 150 city-year observations — compiled from regional environmental agency reporting, mainly ARPA Lombardia and ARPAT.
Five cities introduced a ZTL in 2015 and form the treated group: Torino, Milano, Firenze, La Spezia and Pescara. The other ten — Bergamo, Bologna, Brescia, Ferrara, Padova, Parma, Pisa, Venezia, Verona and Vicenza — are the comparison.
What I built
A difference-in-differences model with city and year fixed effects, so each city is compared against its own history and every year's national conditions are absorbed. Standard errors are clustered by city.
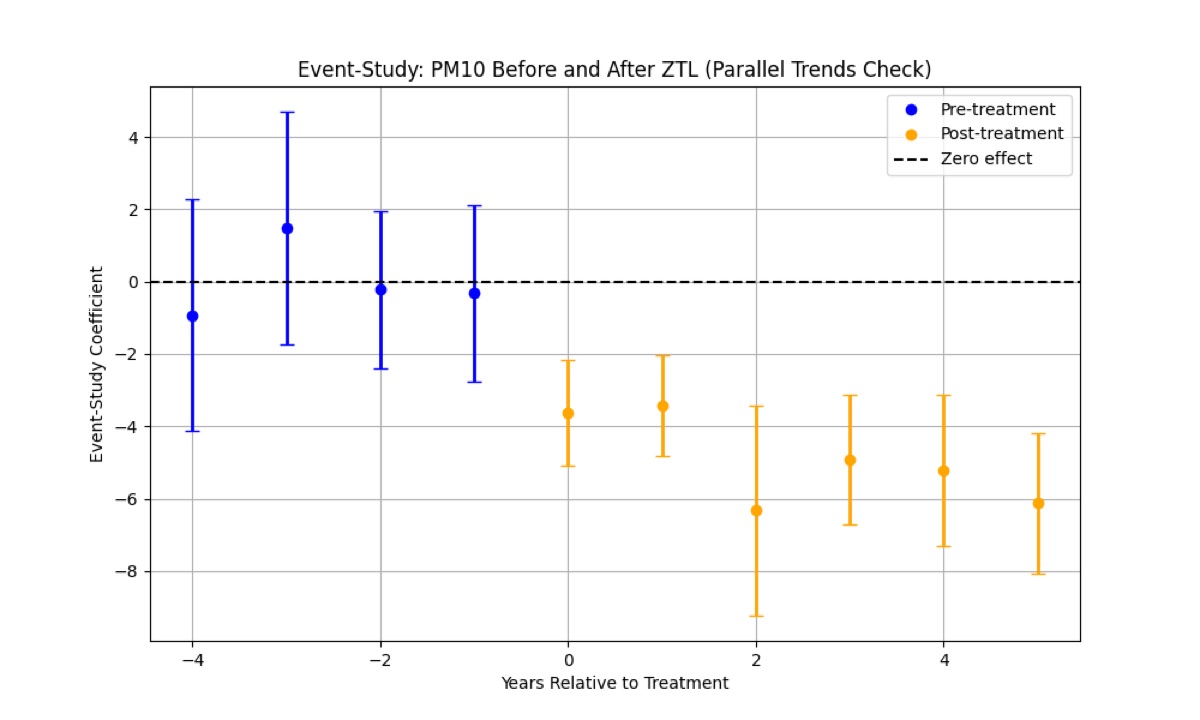
The identifying assumption — that treated and control cities would have moved together without the policy — is not assumed but plotted. An event study estimates a separate coefficient for each year relative to 2015, which shows whether the two groups were already diverging beforehand. It is backed by placebo tests on years when nothing happened, and by re-estimating the model with each treated city dropped in turn.
The result
PM10 in the ZTL cities fell by roughly 4.9 µg/m³ more than in the comparison cities (standard error 1.0). The event study is the more convincing half of that: the pre-2015 coefficients straddle zero, so the groups were on a common path, and the gap opens from the year of introduction.
Two limits are worth stating plainly. Fifteen cities is a small number of clusters, so the standard errors deserve more caution than their size suggests. And 2015 was not a year in which those five cities changed only one thing — the estimate belongs to the whole package of measures a city that introduces a ZTL tends to adopt, not to the traffic zone alone.
Technical notes
For anyone who wants the detail.
With city and year fixed effects, the treatment variable is the interaction of being a treated city and being in a post-2015 year; the level terms are absorbed by the fixed effects. Clustering by city allows each city's residuals to be correlated over time, which they plainly are.
The robustness work matters more than the headline coefficient. Dropping Milano, Torino, Firenze, La Spezia or Pescara one at a time tests whether a single city is carrying the result, and the placebo runs assign a fake policy year to check that the method does not find effects where none exist.